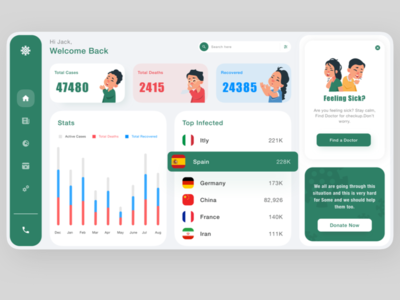
销售分析的仪表板(Dashboard for Sales Analytics)
插图")
插图1")
插图2")
插图3")
-中文-
?有项目想法?我们可以接受新的项目!
info@ronasit.com | Telegram | WhatsApp Facebook | Linkedin | Website
做出数据驱动的决策是使企业盈利的一种方式。销售仪表板可以为公司所有者提供有关利润、客户和团队生产力的宝贵信息。认识一下我们的销售仪表板的新概念!
这个仪表板显示一个反映在线和离线销售成功的图表,以及反映总收入和客户活动的统计数字。此外,还有一个最畅销产品的列表。
对于这个概念,我们的设计师选择了一个严格的白色和黑色的色调。他们用浅蓝色、绿色和紫色来点缀主要的用户界面元素和统计数据。
生动的点缀颜色使统计数据易于分析和比较。这个概念的整个信息被划分为多个区块,因此仪表盘数据便于感知和浏览。
-英文-
? Have a project idea? We are available for new projects!
info@ronasit.com | Telegram | WhatsApp | Facebook | Linkedin | Website
Making data-driven decisions is one way to make your business profitable. Sales dashboards can provide company owners with valuable information about profits, customers, and team productivity. Meet our new concept of a sales dashboard!
This dashboard displays a graph that reflects the success of online and offline sales and stats that reflect the total number of earnings and customer activity. Also, there is a list of top-selling products.
For this concept, our designers chose a strict white and black color palette. They spiced it with light blue, green, and purple colors that accent the main UI elements and stats.
The vivid accenting colors make the stats easy to analyze and compare. The entire information of this concept is divided into blocks, so dashboard data is convenient to perceive and navigate.