丰富多彩的图形用户界面(Colorful Graph UI)
插图")
-中文-
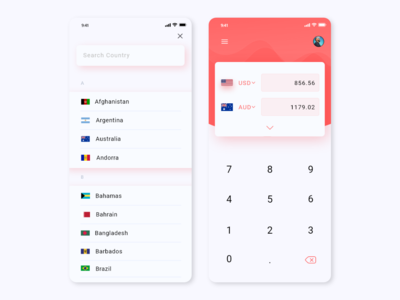
使用EpicCoders提供的这个免费的UI工具包进行统计,该工具包以简单而实用的设计为特色,以衡量你在任何你感兴趣或关注的领域的后见之明。
无论你是想清楚地了解你从股市获得的收益、利润、成绩、你的订户数量,还是想每天或每周跟踪你的成就和任务,这个UI套件都可以帮助你用图表来分类,使你的活动可视化并帮助你评估。你所需要的只是输入它所需要的数据来追踪必要的统计和分析。现在就下载它并享受吧
在下载之前,你可能想检查套件中的所有文件。
您的反馈和意见对我们来说非常重要如果您有任何问题、担忧或建议--请不要犹豫,在我们的社交媒体页面上联系我们,我们会尽快回答。
谢谢你,祝你设计愉快!
-英文-
Go and do your statistic with this free UI Kit from EpicCoders that features two graphs in simple but functional designs to measure your hindsight in whatever areas of your interest or concerns.
Whether you want to have clear-cut view of your earnings from the stock markets, profits, grades, number of your subscribers or eve to track you achievements and task daily or weekly, this UI kit can help you sort it all with a graph that will visualize and help you assess your activities. All you need is to input the data it needs to track down the necessary stats and analytics. Download it now and enjoy!
You may want to check all the files in the kit before you download it.
Your feedback and opinions are very important to us! Should you have a question, concern or suggestion - don't hesitate to reach us out on our social media pages and we'll answer as soon as we can.
Thank you and enjoy designing!